Casino Management SaaS
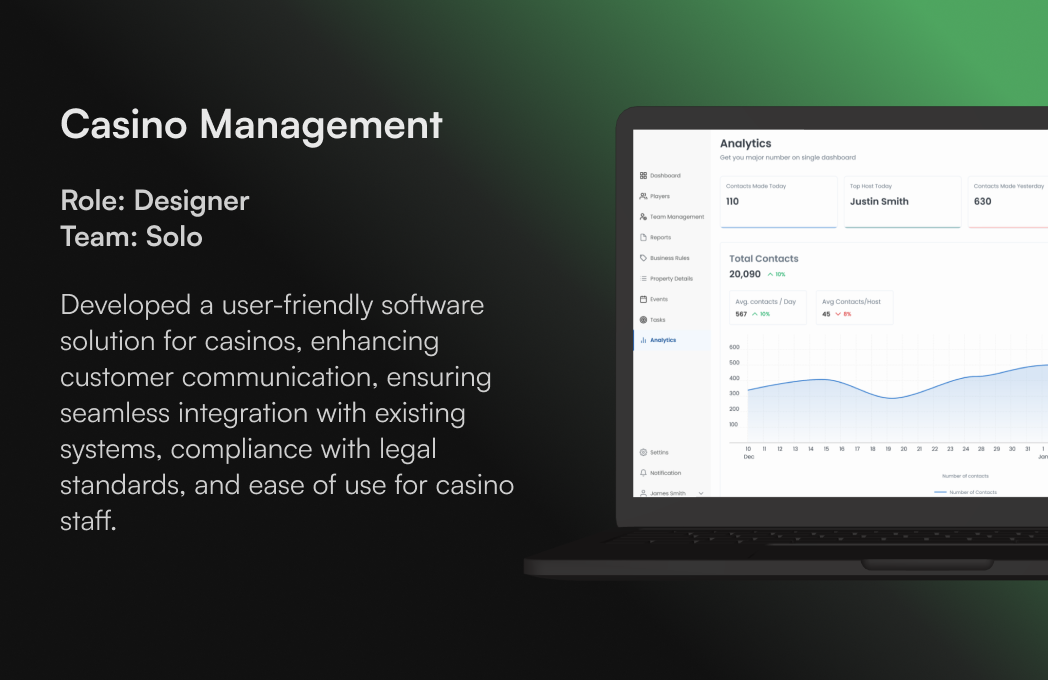
I designed a casino management platform that turns dense operational data into clear, actionable dashboards for floor managers, hosts, and executives. User engagement rose 25 percent.
Outcome
I designed data-dense enterprise dashboards for a casino management SaaS and a scalable design system to support them. User engagement rose 25 percent in testing.
Context
I worked as a freelance Senior Product Designer for AlliedWorks from October 2024 to June 2025. The product was an enterprise casino management SaaS. The work was end to end, from research and information architecture to high-fidelity design and a reusable component system, across three user roles.
The Problem
Casino operations generate huge volumes of real-time data: player activity, game performance, revenue streams, staff allocation, and security events. That data lived in disconnected legacy systems. Floor managers relied on gut instinct. Executives waited days for reports. Hosts had no way to track player relationships at scale.
The challenge was to make complex data feel simple without losing depth.
What I Did: Research to Design to System
What I Delivered
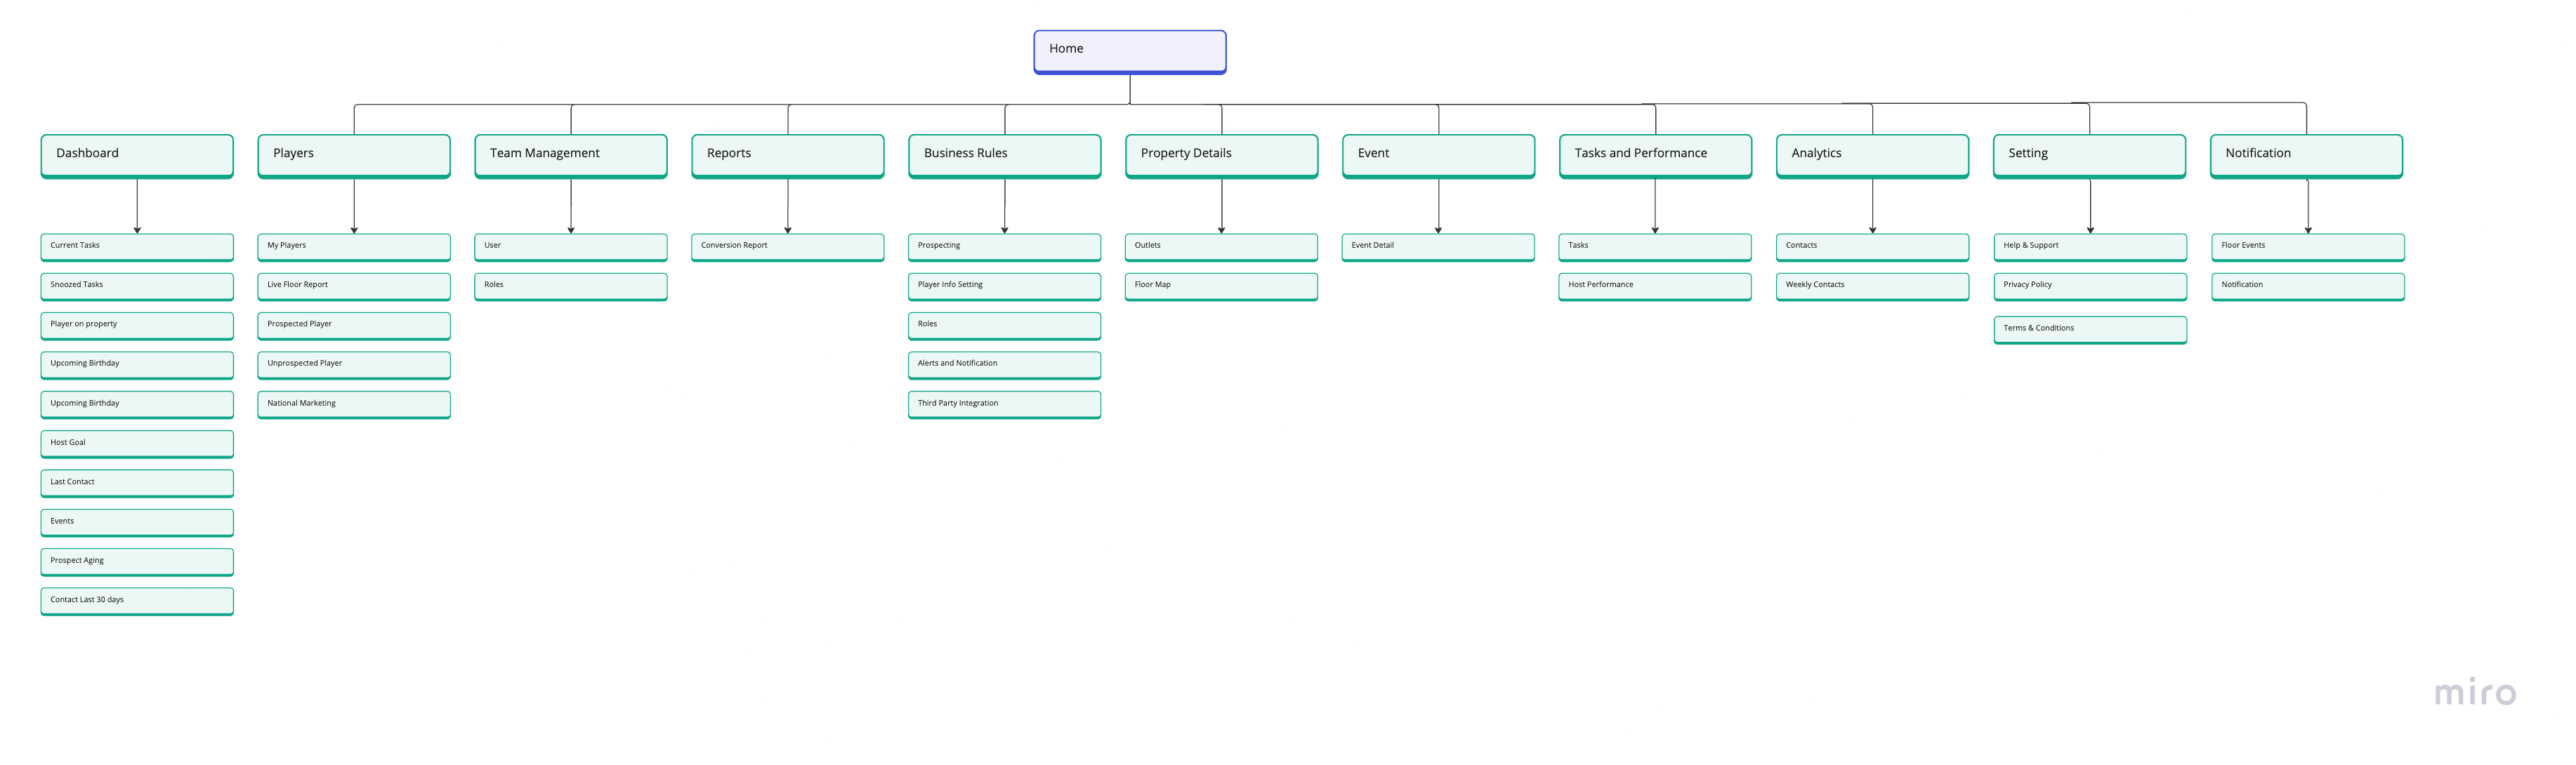
Information Architecture
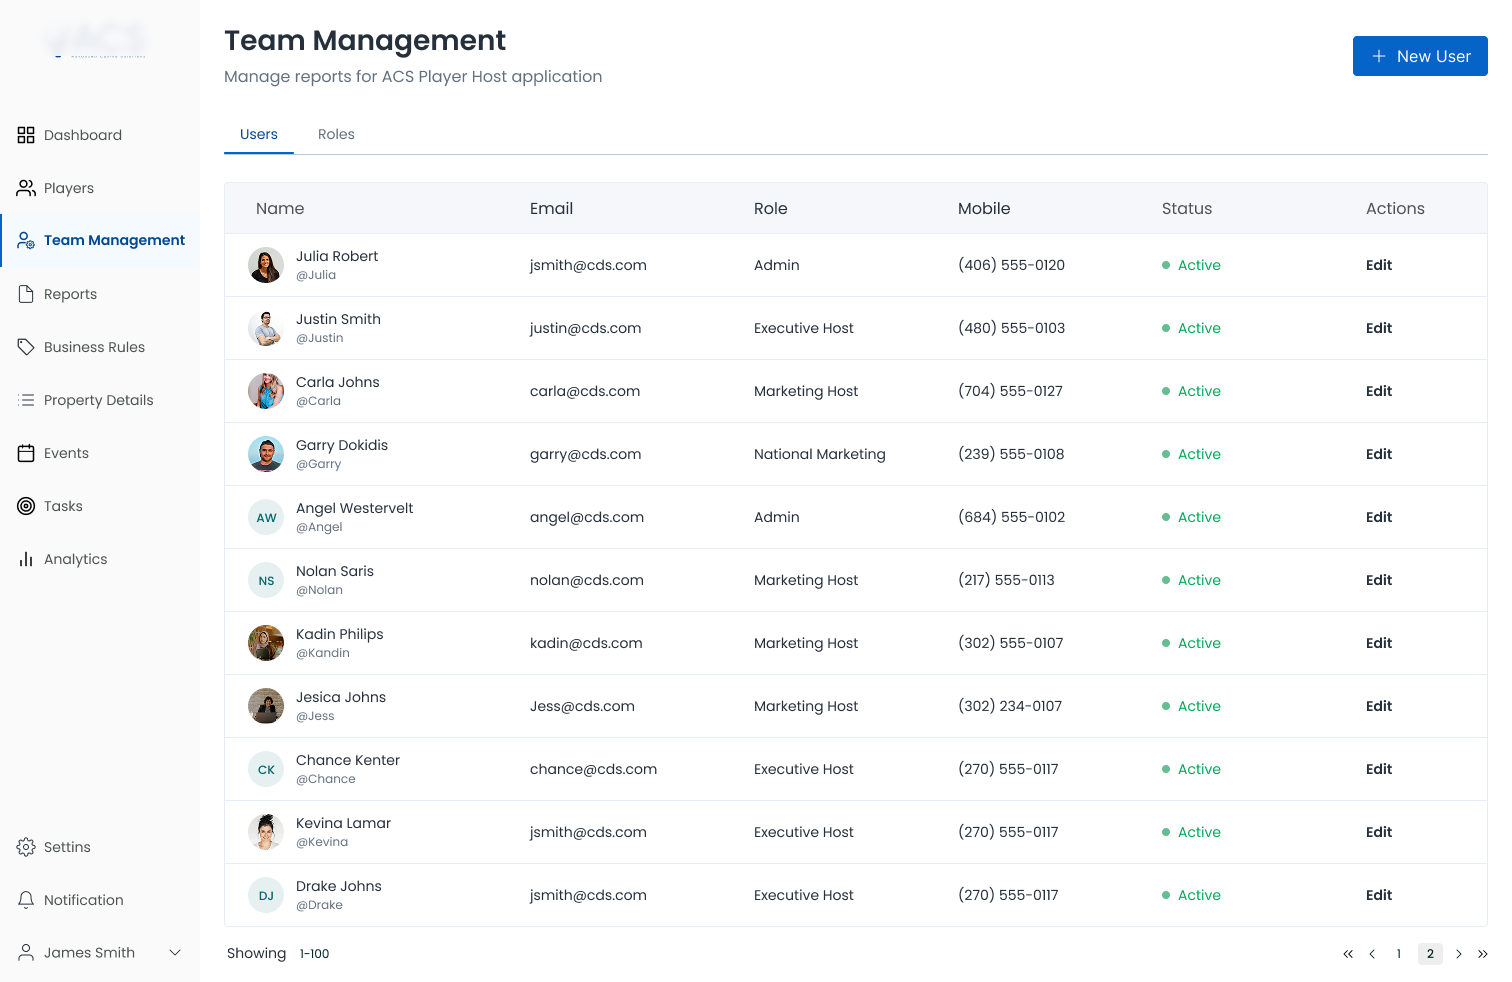
I mapped the full data model (player profiles, game performance, staff capabilities, and revenue attribution) into a coherent navigation structure that serves three distinct user roles. The hard part was building one unified system where executives, floor managers, and hosts each reach the data they need without drowning in what they do not.
Role-Based Dashboards
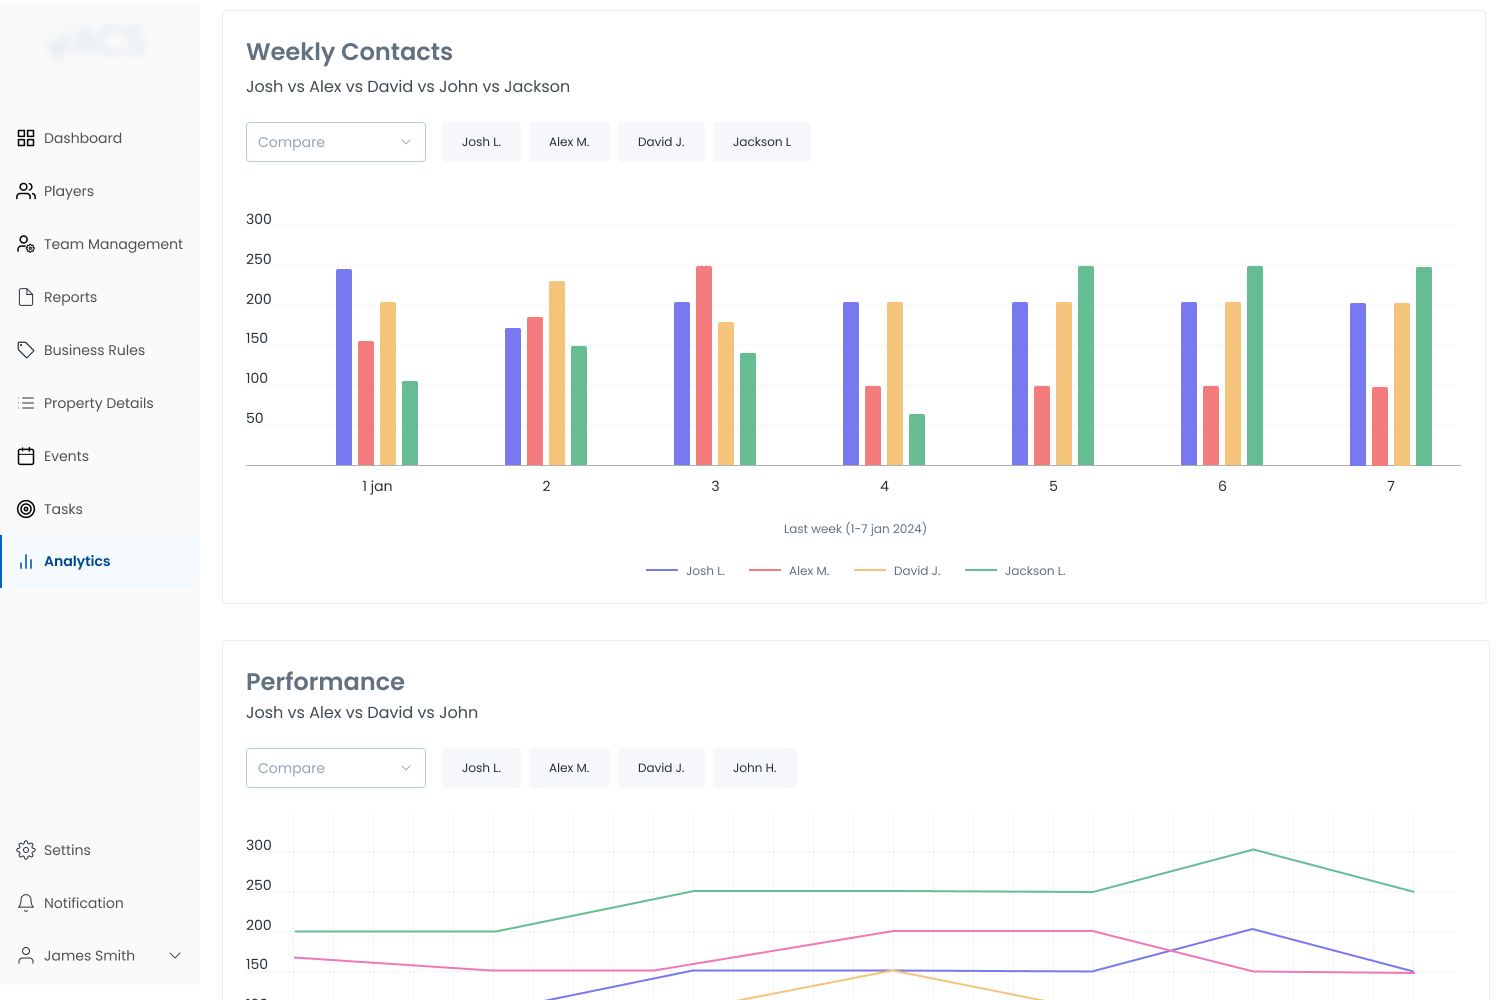
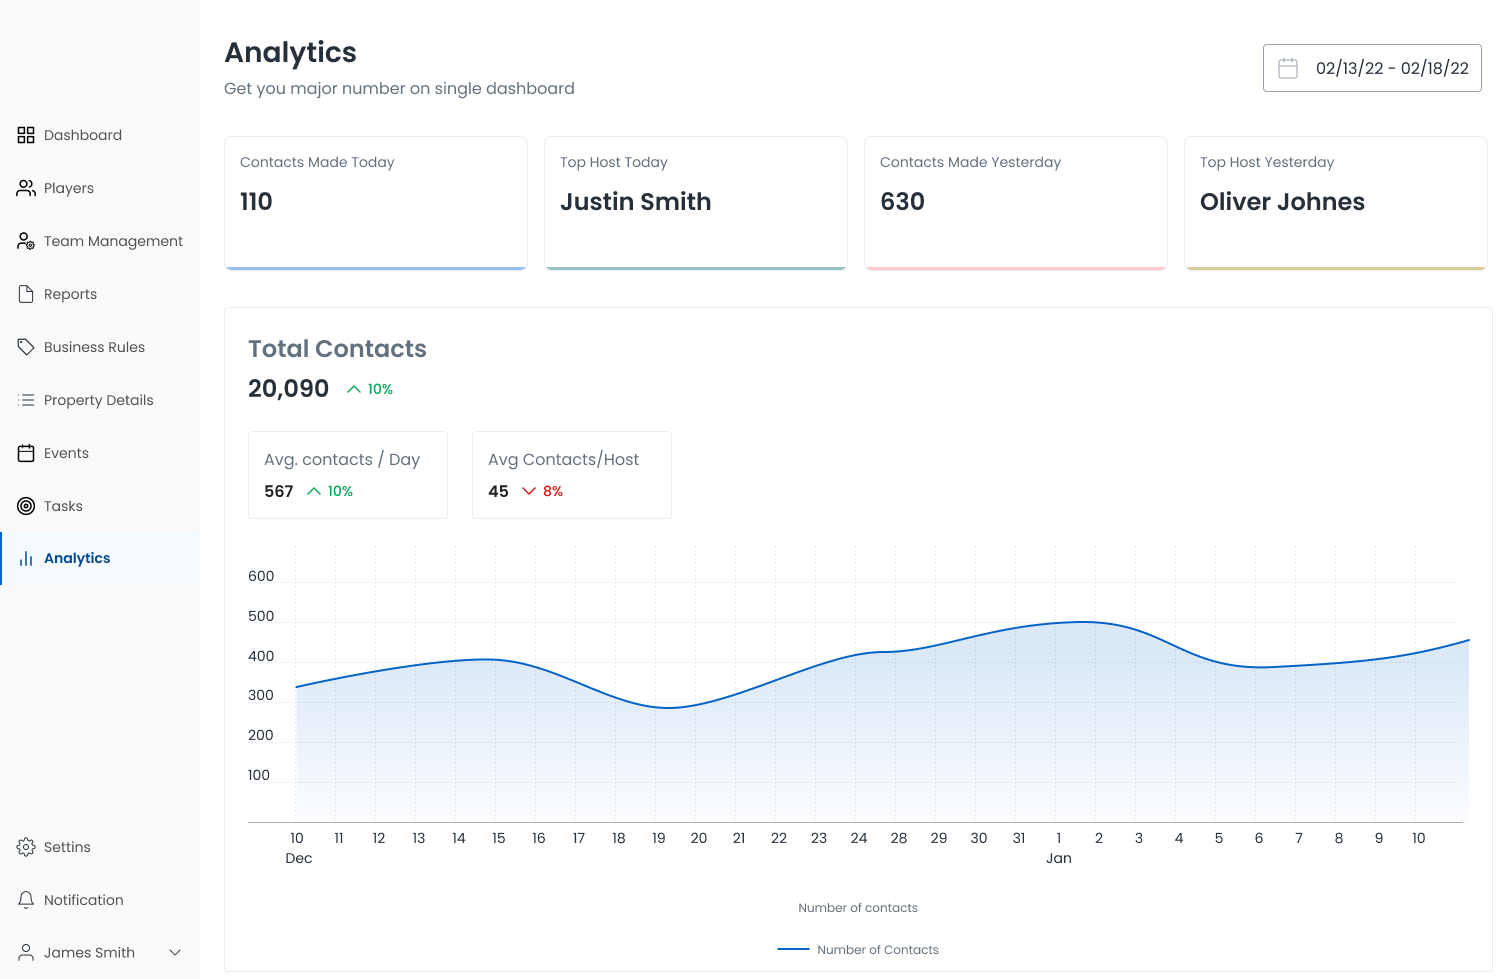
- Executive view. High-level floor health, revenue trends, and anomaly alerts, built for 10-second decisions.
- Floor manager view. Real-time game performance, player activity heat maps, and staff deployment.
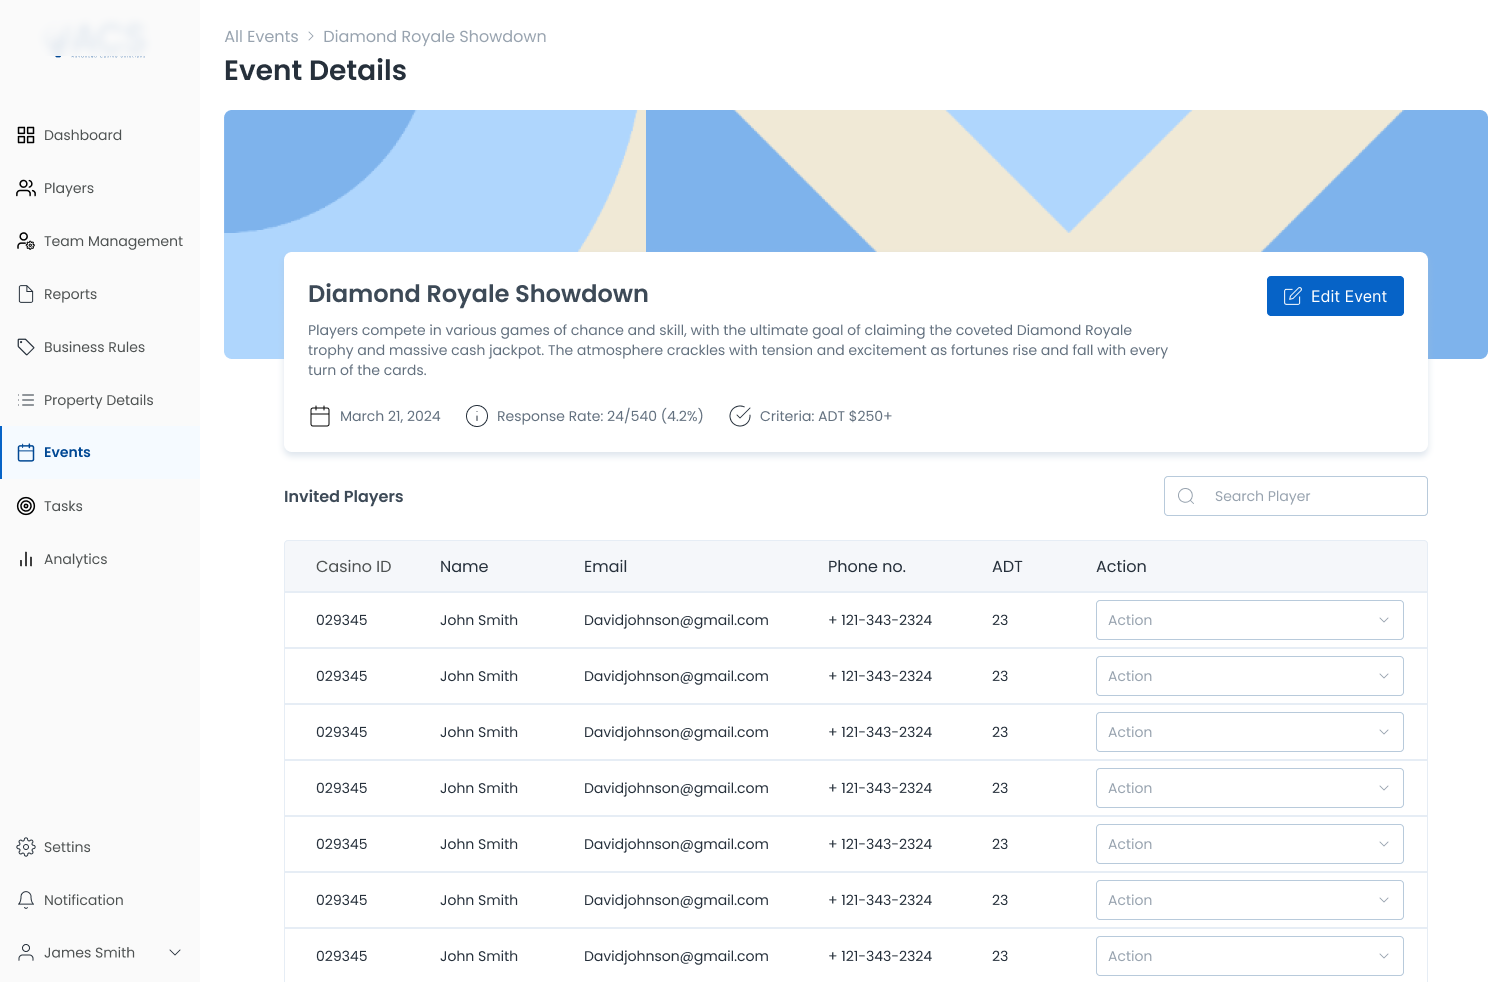
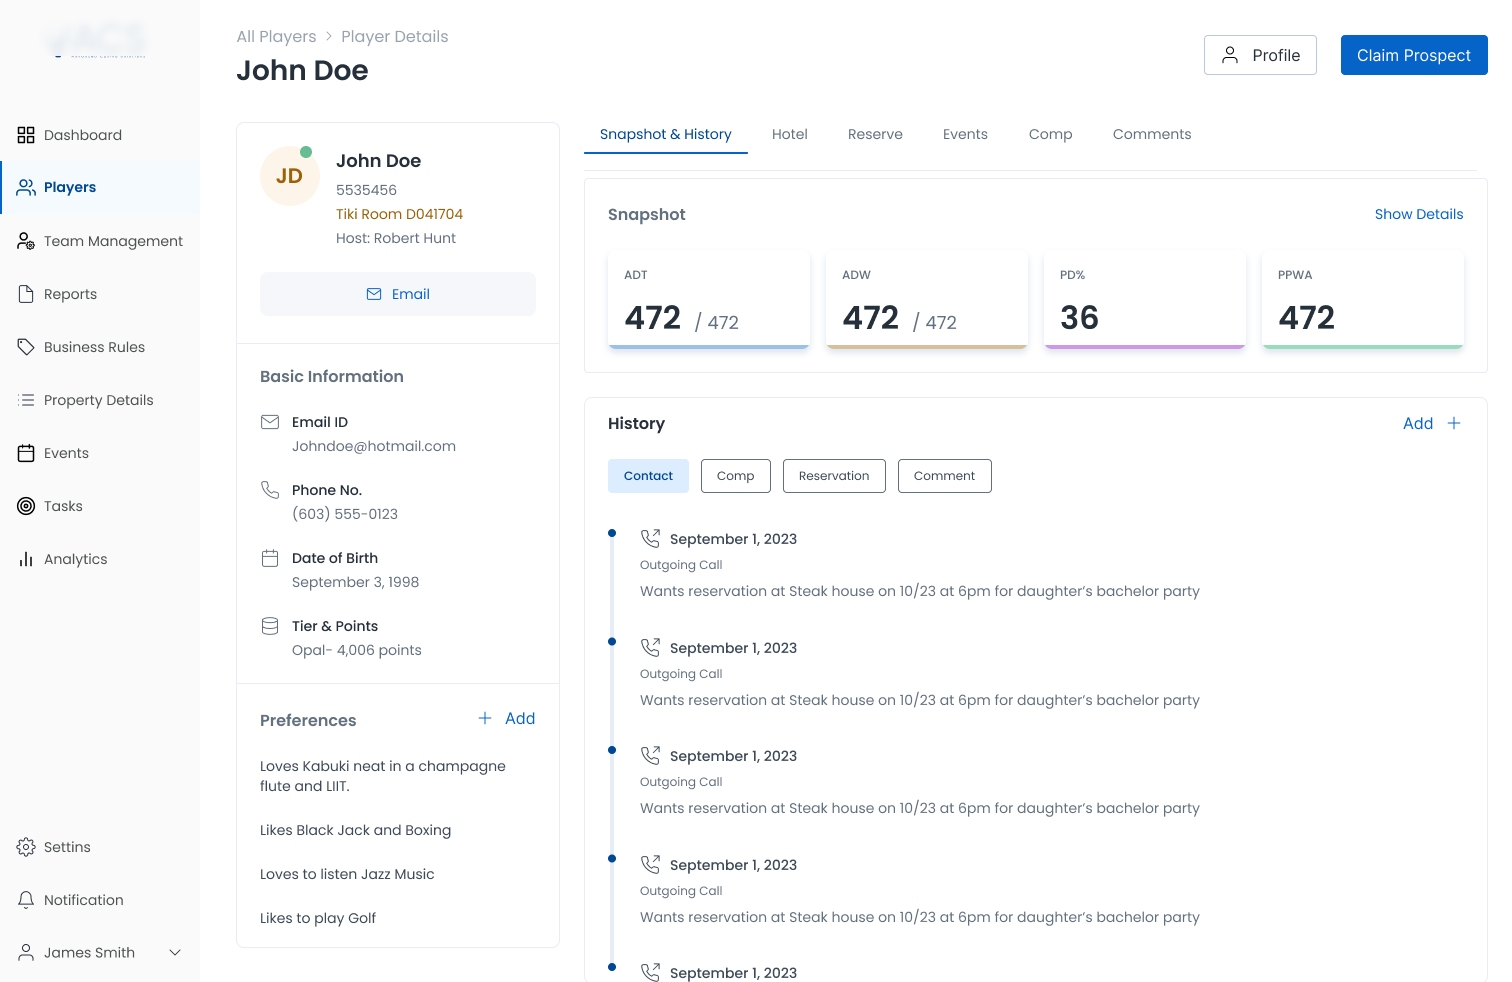
- Host view. Player relationship management, visit history, preference tracking, and personalized engagement tools.
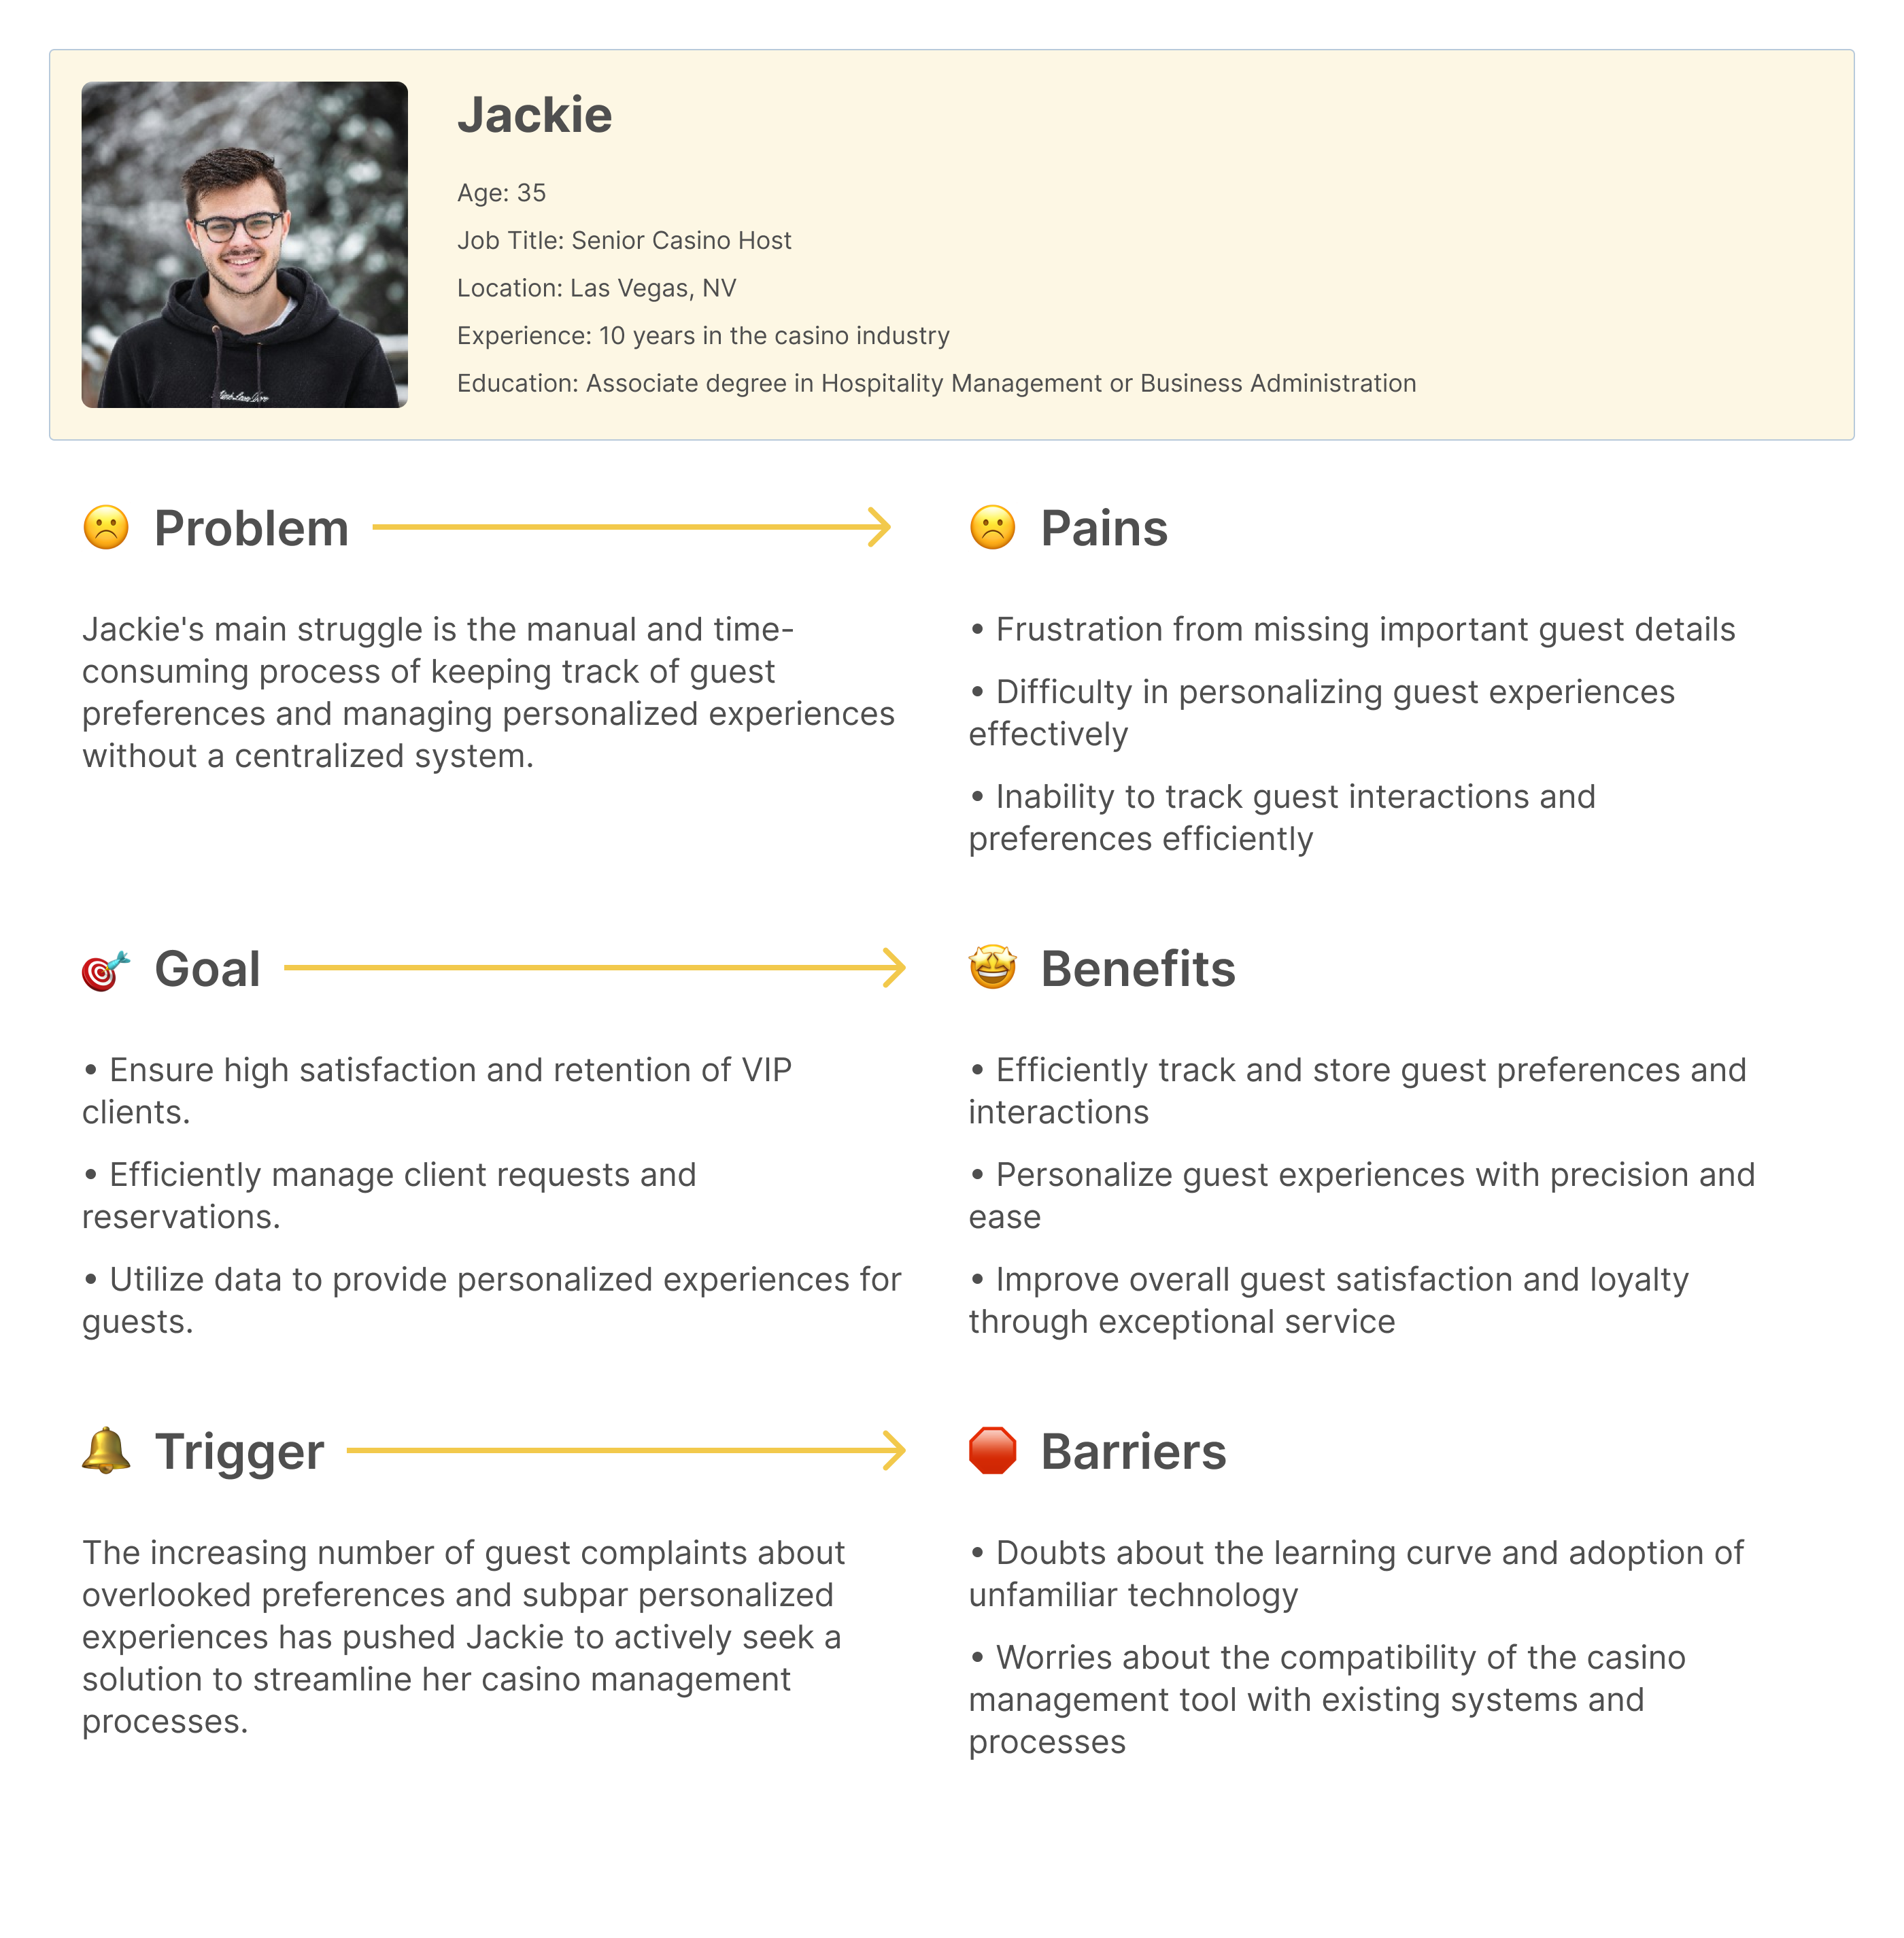
User Research & Personas
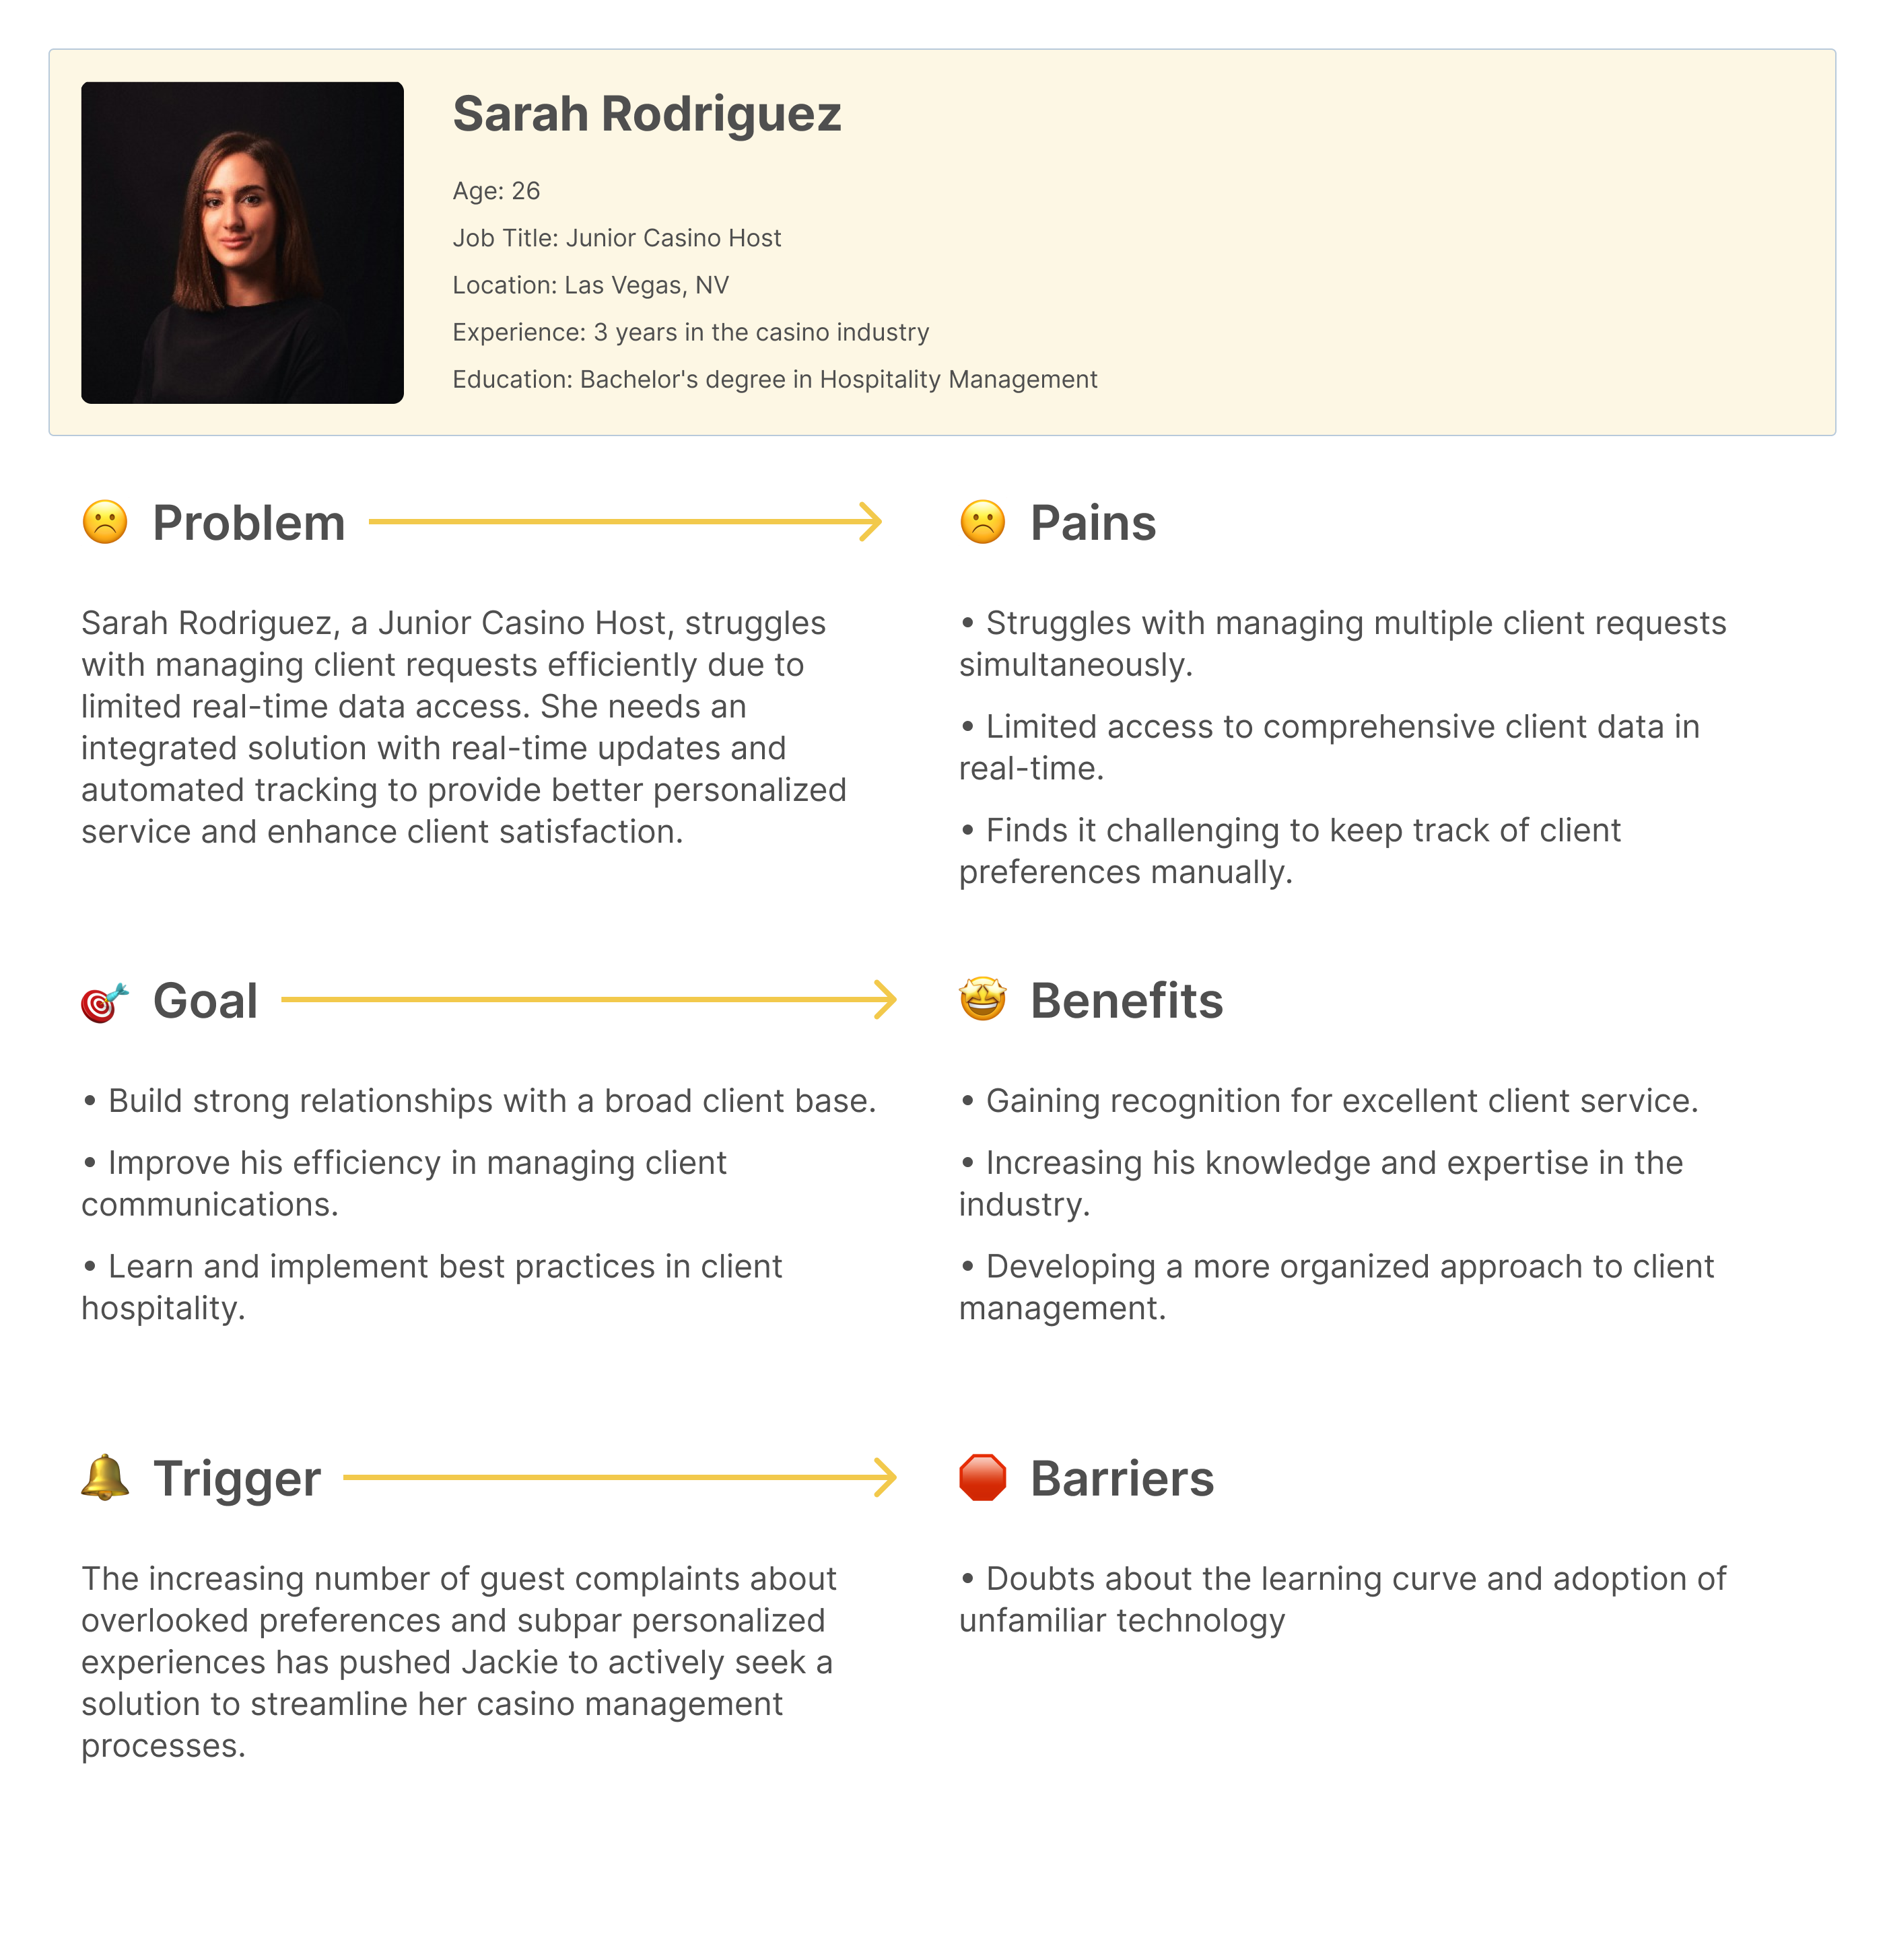
Developed detailed personas for each role through stakeholder interviews, mapping their daily workflows, pain points, and decision-making patterns. Each persona informed specific dashboard configurations and information hierarchy.
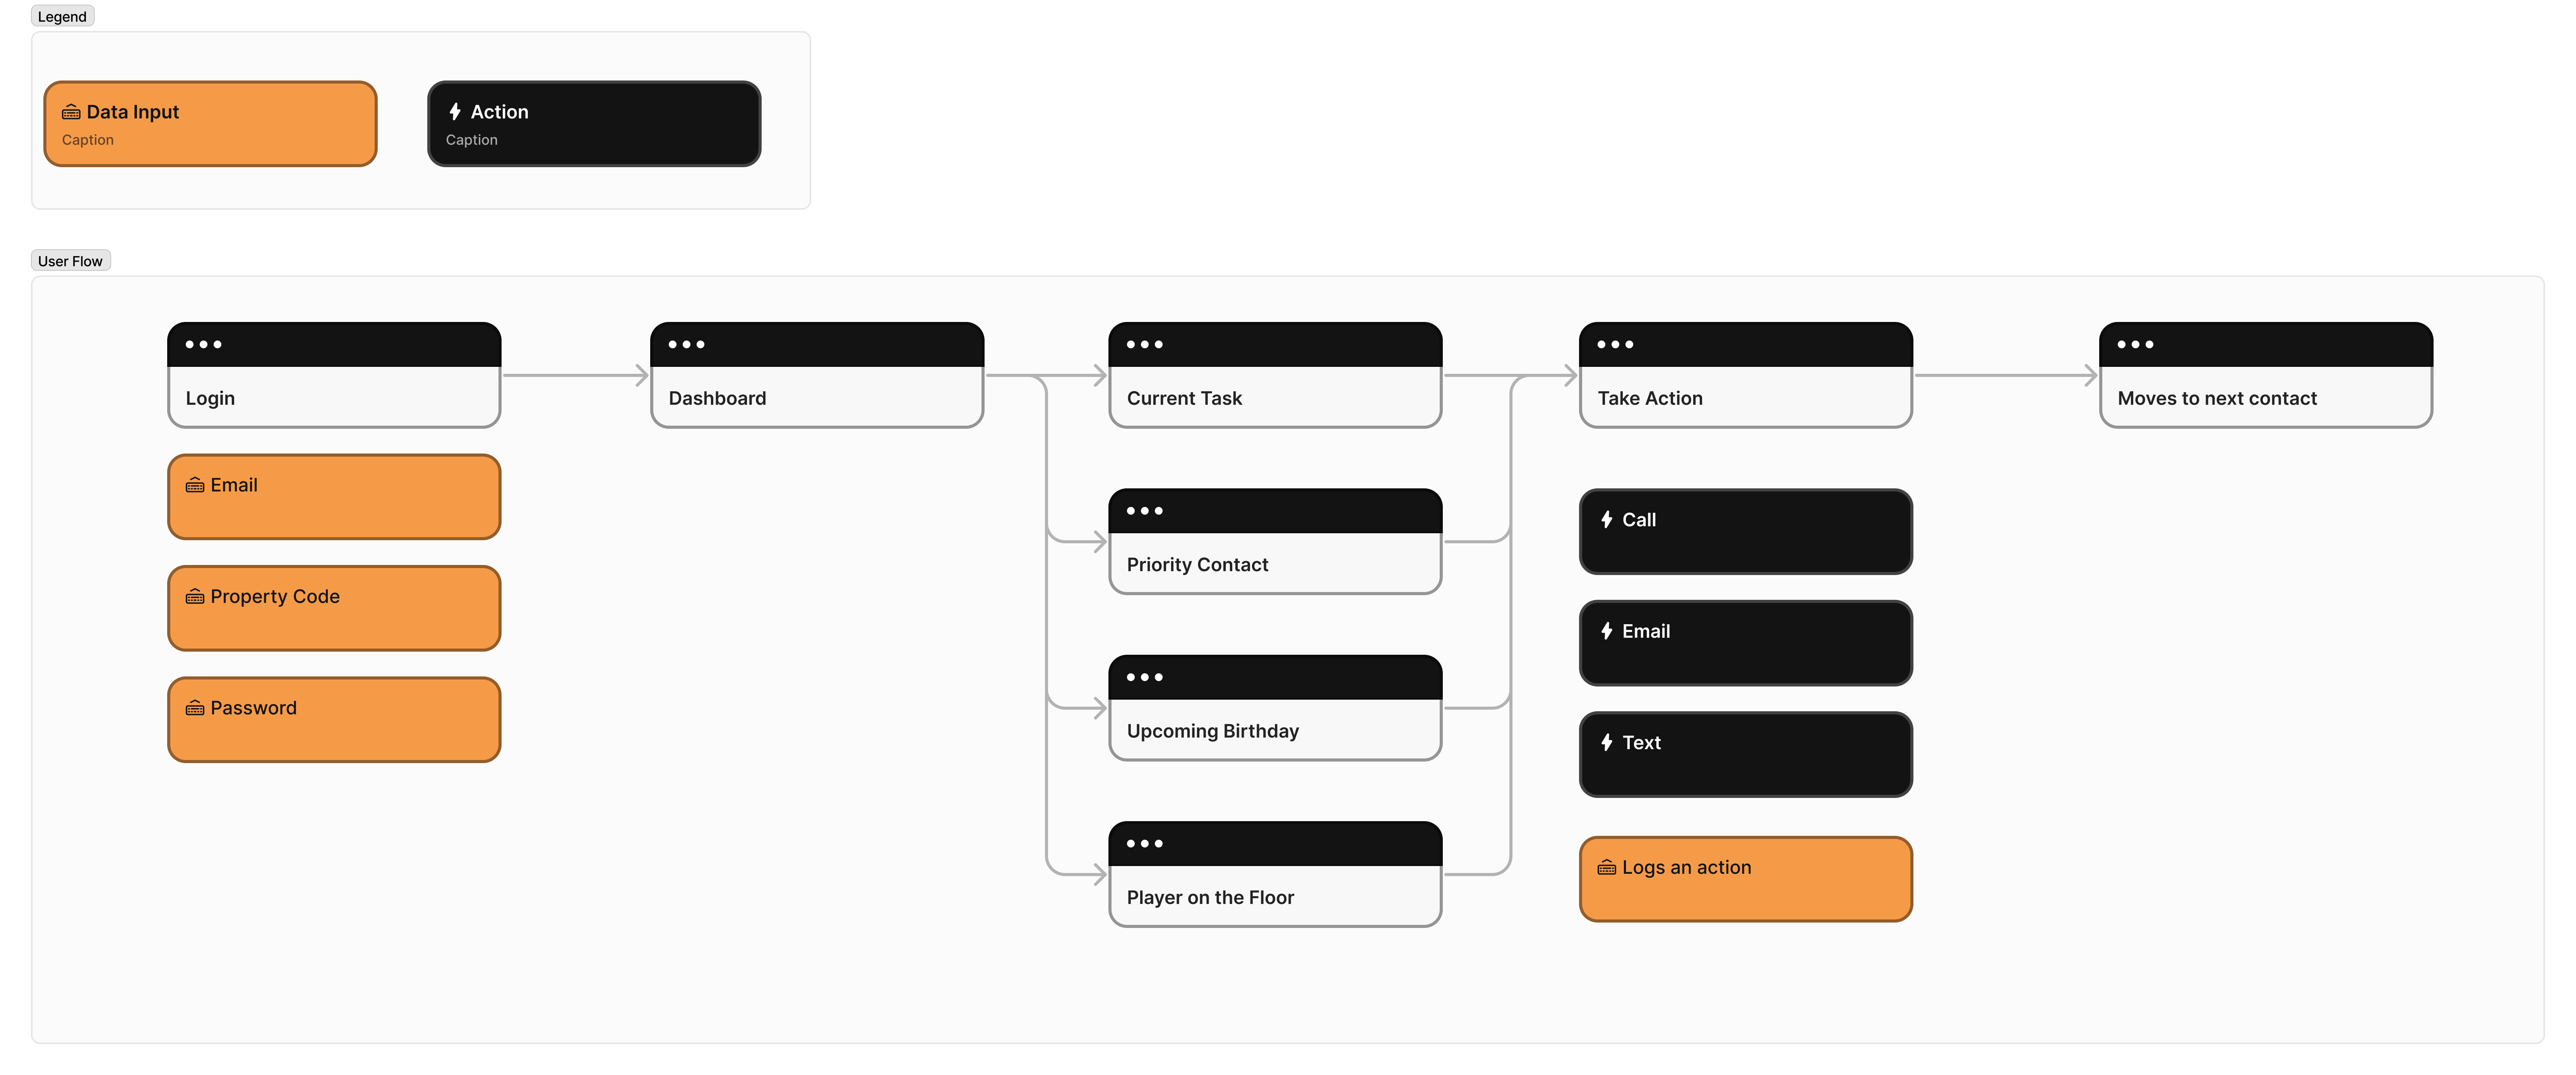
User Flows
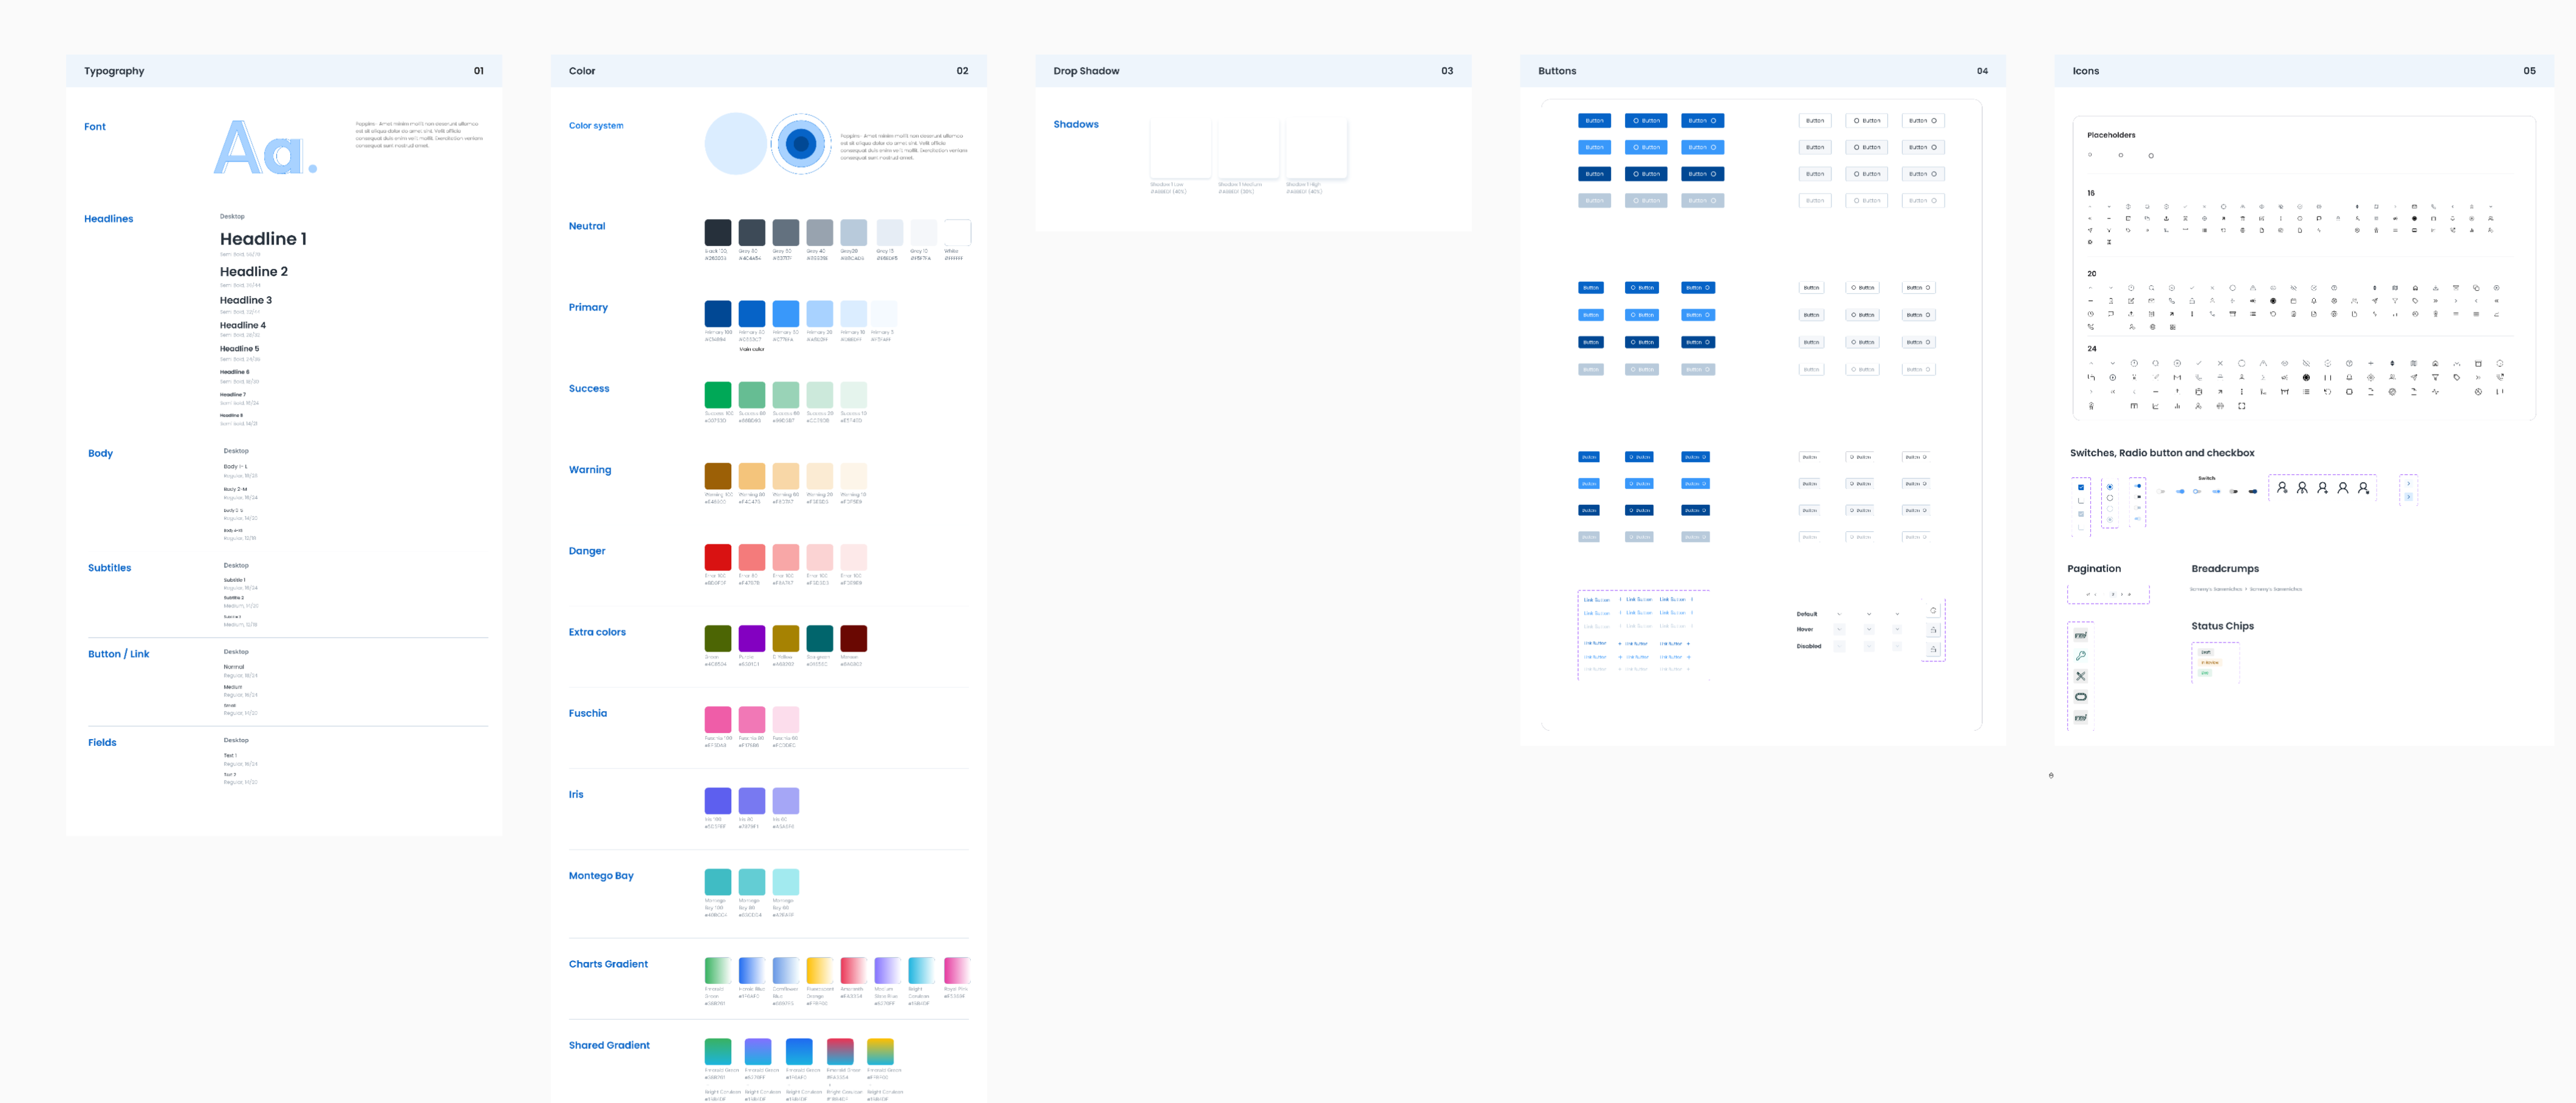
Data-Dense Design System
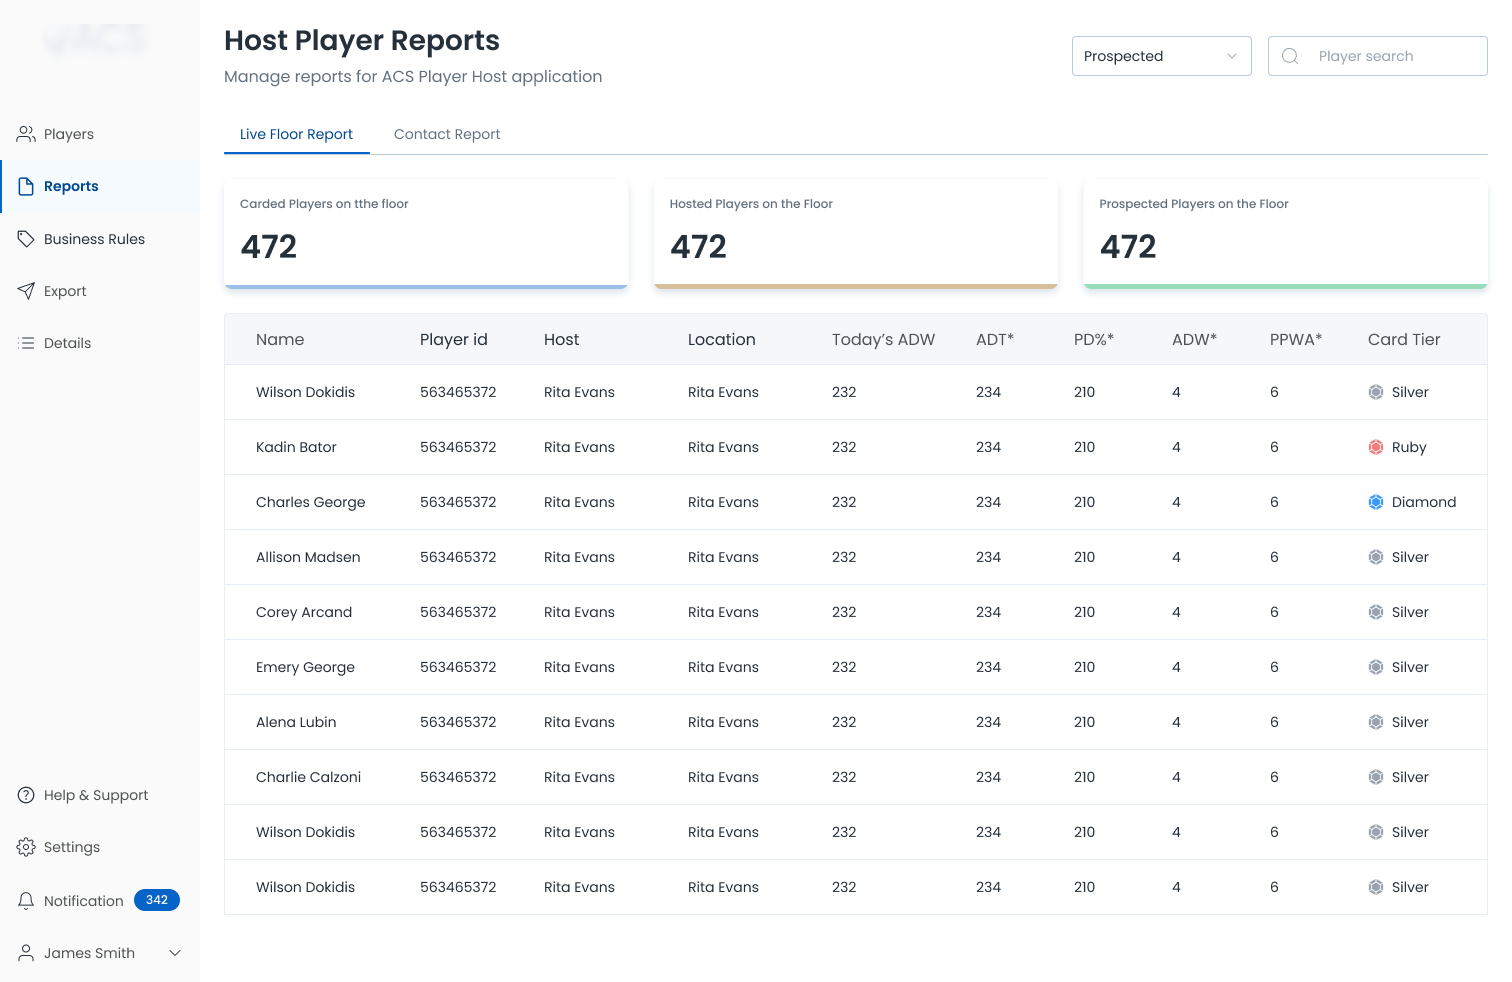
I built a scalable, high-contrast component library tuned for legibility in low-light casino environments. Custom tables, chart patterns, and data card layouts handle hundreds of data points without cognitive overload, and they scale cleanly as the product grows.
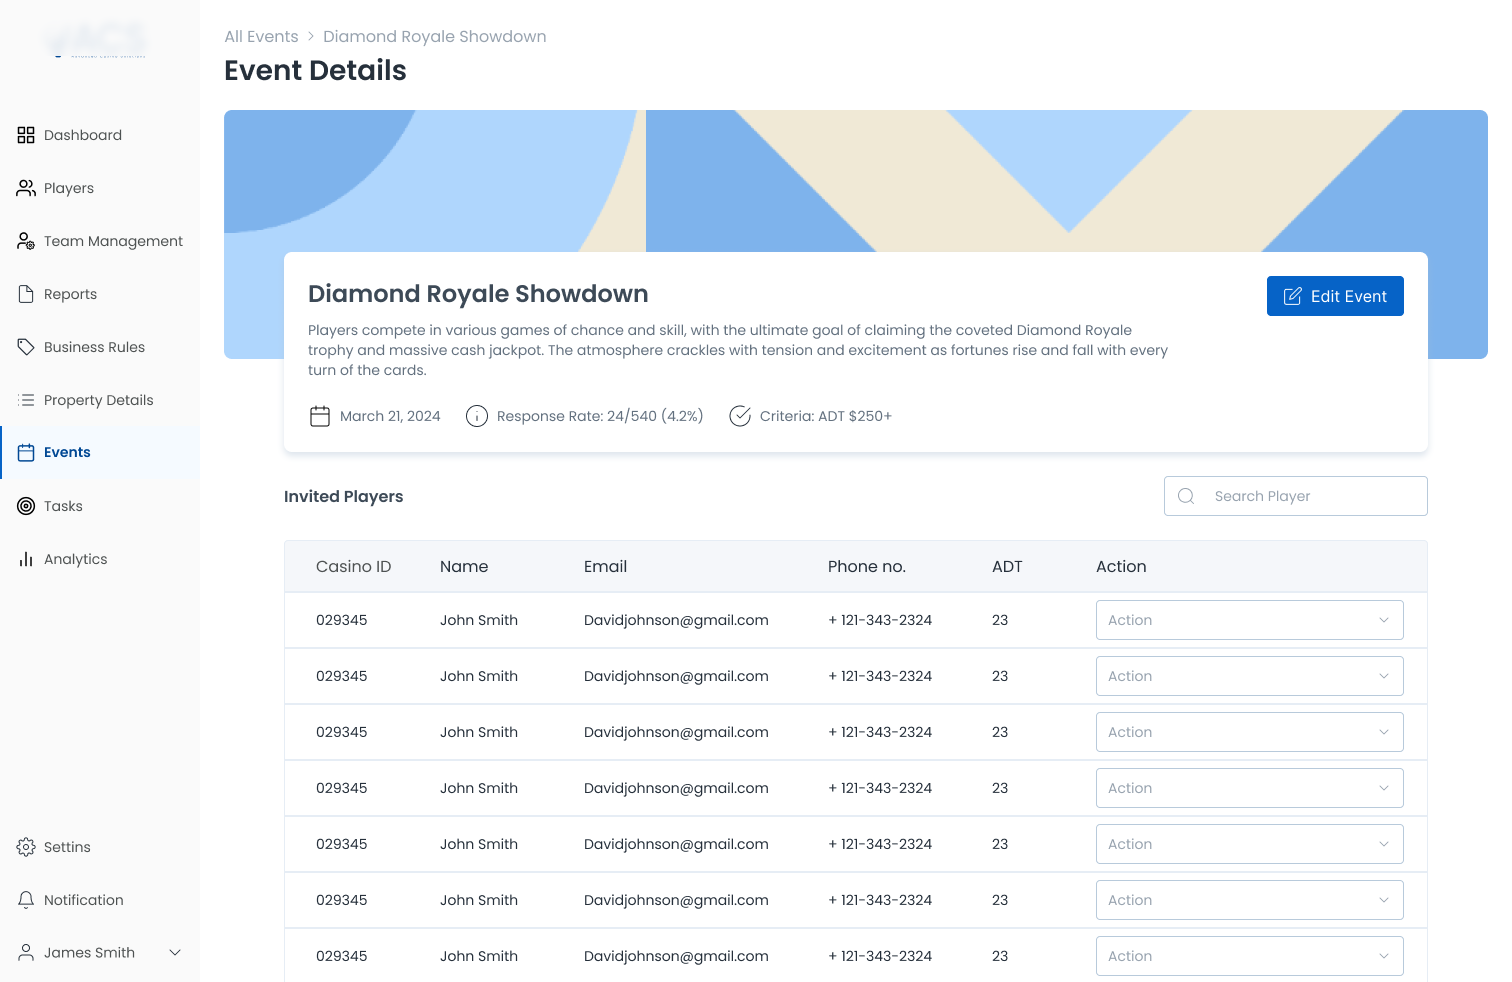
Final UI Screens
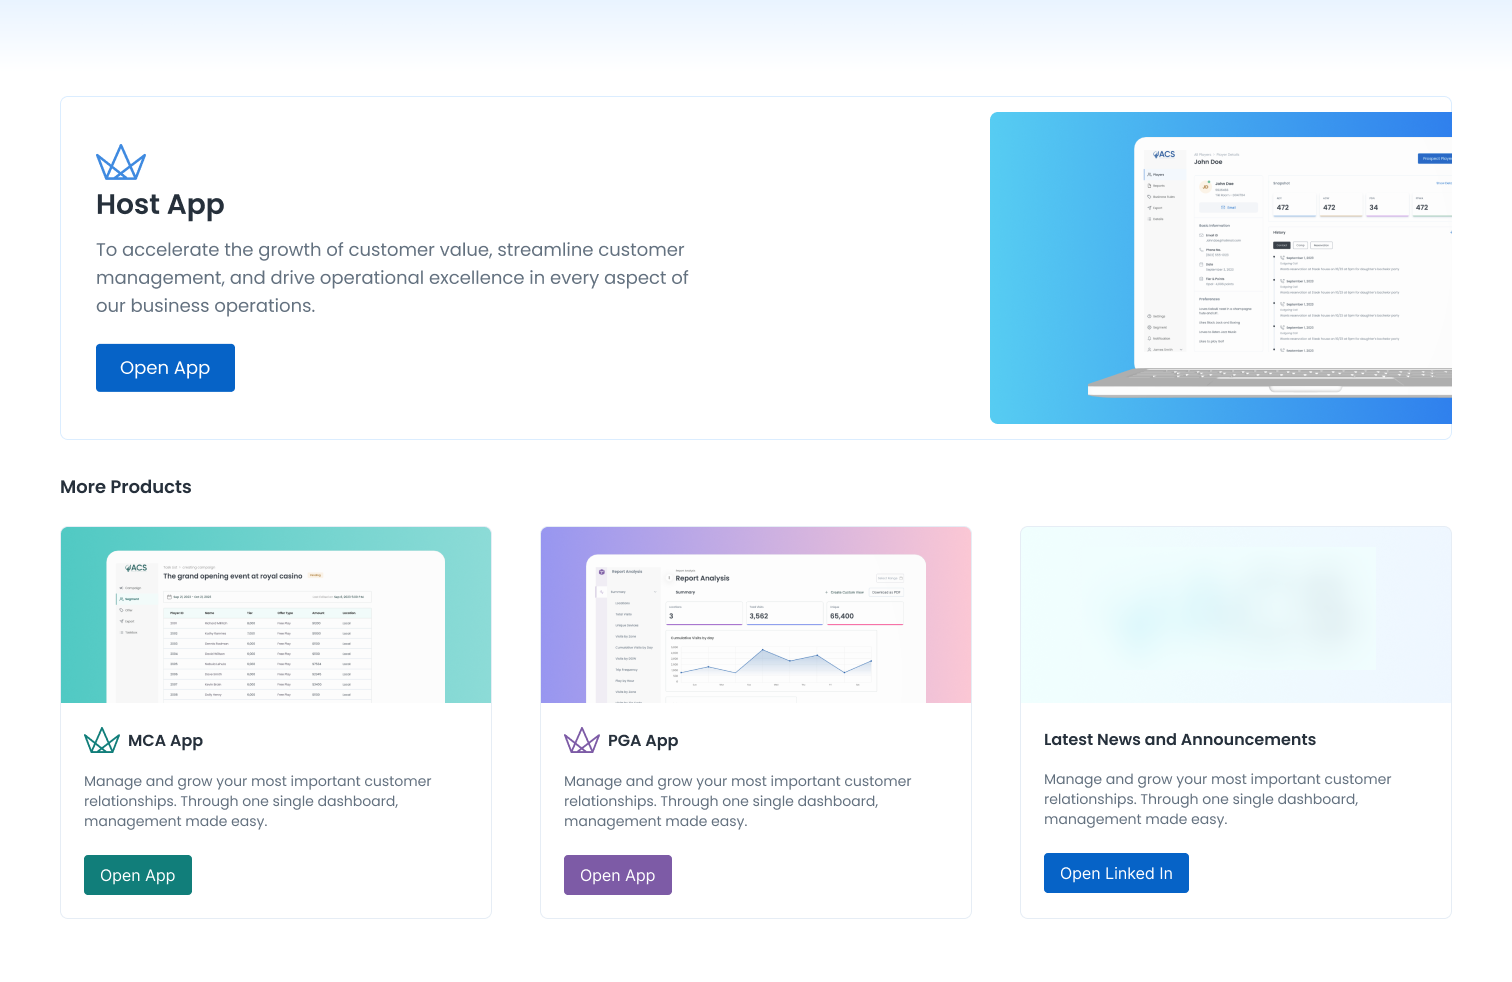
Seven screens across all three user roles: executives, floor managers, and hosts. Each view is purpose-built for its context, so it is always clear what belongs where.
Decisions and Tradeoffs
Design for low light from the start
Casino floors are dim by design, so I built the interface for that context rather than bolting on a dark mode later. The high-contrast palette, luminous accents, and oversized data points were deliberate. The tradeoff was a narrower visual range to work within, but the result was legibility exactly where the product is used.
One system, three roles
Executives, floor managers, and hosts have very different jobs. I could have shipped three separate products, but that would fragment the data and the design. Instead I built one role-aware system with shared components. The tradeoff was a more complex information architecture up front, repaid by faster iteration and a 25 percent lift in engagement.
I designed the dashboard for low-light environments from the start, not as an afterthought dark mode toggle. Casino floors are dim by design. The high-contrast palette, luminous accents, and oversized data points were all driven by the physical context where this product is used.
Results
What I Would Do Next
With more runway, I would validate the dashboards with live floor data, add configurable layouts per role, and extend the design system with usage analytics so the team can see which views drive the most decisions. The foundation is built to scale, and the next step is to let real operators shape it further.